


For most of 2026 the case against SOFI 0.00%↑ came down to a single number: personal loan charge-offs.
The argument was strong, and it was right. If you don’t ignore the app and the brand strength, SoFi is basically a consumer lender that trades at a tech company multiple. But when borrowers stop paying, SoFi’s true nature started to appear. And that’s what took the stock from USD 32.73 down to it’s USD 14.88 low.
In July, that started to change. Charge-offs fell to 2.62% from 3.03%. Deposits grew USD 5.3B in 90 days. Originations hit a record USD 14.8B, membership crossed 15.8 million, and management raised the revenue guide for the year. Despite all that, the stock closed down 8.9%.
Almost 2 months, later it now trades at USD 17.16, around 2.5% above where it sat the day before those results. The bear case that drove a 50% drawdown lost its evidence, and the stock didn’t move.
Turns out bad loans weren’t the only problem.
SoFi is growing revenue at 42% a year and keeping less of it every quarter. Net margin has gone to 16.9%, then 15.2%, then 12.9% across 3 earnings releases. In July, management lifted the revenue guide but did not change the net profit guidance (~USD 0.6 per share). That one decision says a lot.
The argument isn’t about losses any more. It’s about conversion.

Key Takeaways
Q2 delivered record net revenue of USD 1.22B (+42.5%), net income of USD 156.6M (+61%), record originations of USD 14.8B (+69%), and membership of 15.8 million (+35%). That was an 11th consecutive profitable quarter.
Credit improved. The personal loan annualized charge-off rate fell from the prior quarter, down 21 BP year over year, with 90-day delinquencies flat against last year.
The problem moved to the income statement. Quarterly net margin dropped from 16.9% to 15.2% to 12.9% while revenue accelerated, and the adjusted EPS guide stayed the same.
Galileo, the technology segment, fell 23% to USD 84.5M, a third straight decline. That business carries the premium multiple, but lending is carrying the company.
Price sits mid-range in a 6-month base between USD 14.88 and 20.13, with no trend on either timeframe. Support runs 16.50 to 16.90, repair needs a daily close above 18.05, and 15.80 breaks it.
What Actually Changed Since June
SoFi runs 3 segments. Lending covers personal, student, and home loans, and generated USD 724.8M of net revenue last quarter, up 63%. Financial Services holds checking, savings, brokerage, and the credit card, at USD 466.3M, up 29%. Technology Platform is Galileo and Technisys, the infrastructure that powers other companies’ banking apps, at USD 84.5M and falling.
The bank charter is what makes the model work. Deposits now stand at USD 45.5B against USD 60.9B of total assets, which funds the loan book far more cheaply than the warehouse facilities SoFi used before. Management put the gap at 156 basis points last quarter.
Since our June coverage here, 2 things are new.
The loan marketplace, where SoFi originates for third-party buyers and collects fees without keeping the credit risk, stabilized. Third-party personal loan volume came in at USD 3.1B against USD 3.0B the prior quarter, producing USD 140.9M of platform fees. Total fee-based revenue reached USD 472.3M, or 39% of the quarter, up 22%.
The other is the stablecoin build-out. On September 22, SoFi moved its entire USD 25B card program to settle on Mastercard’s network in SoFiUSD, its own USD-pegged token. Shares popped almost 6% intraday and but it didn’t stick by market closing time.
Fundamental Analysis
The headline numbers are better than the share price implies.
Net revenue: USD 1.22B in Q2, up 42.5% year over year. Trailing 12-month revenue USD 4.31B.
Net income: USD 156.6M, up 61%. Trailing 12-month net income USD 636.3M.
Adjusted EBITDA: USD 357.8M, up 44%, at a 30% margin.
Originations: USD 14.8B, up 69%, a record. Personal loans USD 10.7B, student USD 2.7B, home USD 1.4B.
Members: 15.8 million, up 35%, with a record 1.1 million added. Products 24.4 million, up 42%.
Deposits: USD 45.5B, up USD 5.3B in the quarter.
Tangible book value: USD 7.34 per share, up 56%.
Net interest margin: 5.98%, up 4 basis points from the prior quarter.
Margin on the lending book widened last quarter rather than shrank. Average asset yields did fall 32 BP year over year, but cheaper deposit funding more than absorbed it.
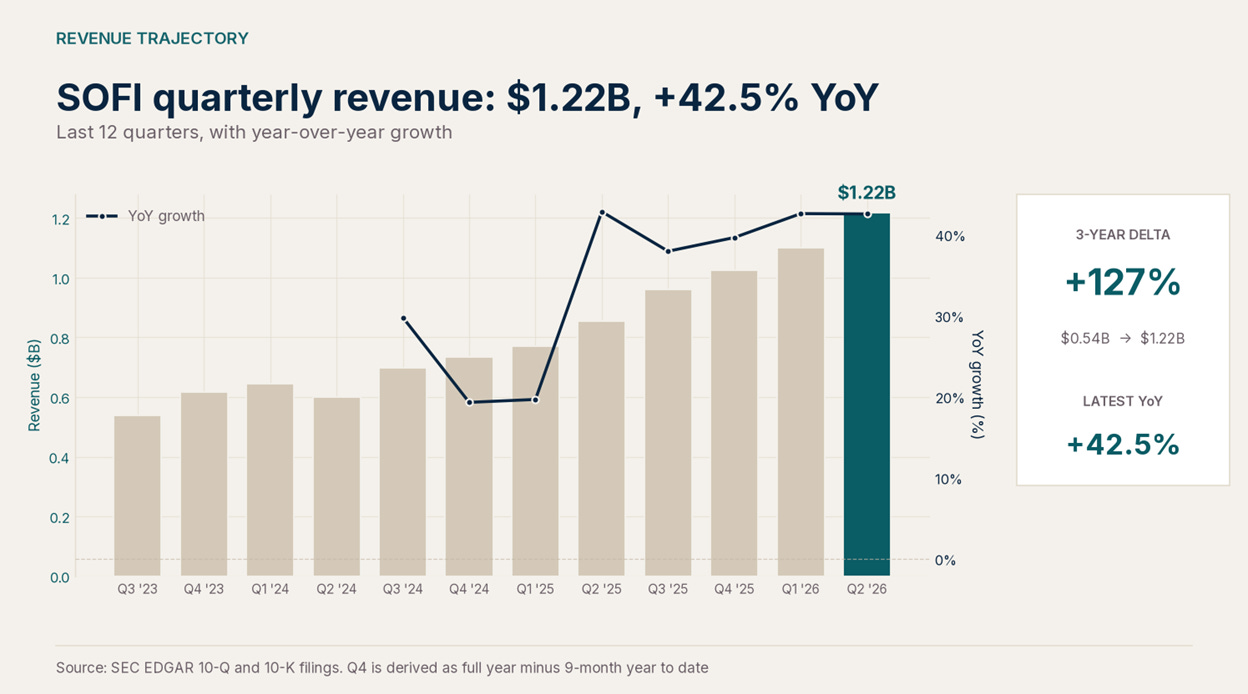
So where did the money go?
Into cost and tax, not credit. The provision for credit losses was USD 13.8M in the quarter, up USD 3.7M from a year earlier, which is far too small to account for it.
Revenue grew USD 118M from the March quarter while net income fell USD 10M. Every dollar of incremental revenue arrived with equivalent incremental cost behind it.
Net margin has now compressed 3 quarters in a row, from 16.9% in the December quarter to 15.2% in March to 12.9% in June, and adjusted EPS has come in at USD 0.12 for 3 straight quarters too. The full-year guide assumes an effective tax rate near 22%.
Growth that doesn’t reach the bottom line is growth the market discounts. That’s the 8.9% selloff, and the April earnings report warranted a similar reaction.
On the valuation:
P/E (TTM): 34.8. Forward: near 29x this year’s USD 0.60 consensus and about 21x next year’s USD 0.83.
P/S (TTM): 5.1. P/B: 2.0, or 2.3x tangible book.
Net margin (TTM): 14.8%. ROE (TTM): 6.2%.
Debt/equity: 0.31, with USD 3.41B of debt against USD 3.13B of cash. Net debt is roughly USD 279M.
Consensus: mean target USD 20.34, median USD 19.00, range USD 12 to USD 30, across 22 analysts, with an overall rating of hold.
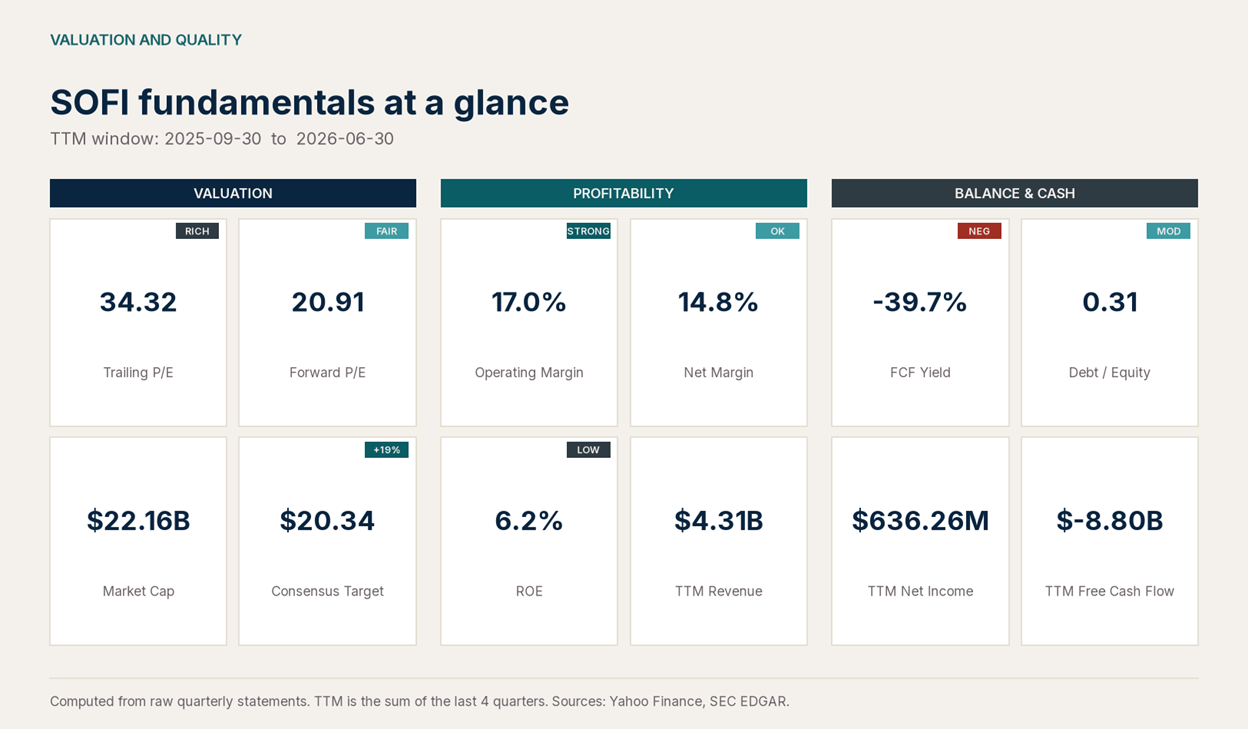
The 6.2% return on equity is the weak spot. Robinhood HOOD 0.00%↑ earns 23.6% RoE and trades at 55x trailing earnings. Ally ALLY 0.00%↑ earns 9.7% and trades at 9x. SOFI 0.00%↑ earns 6.2% and trades at 35x.
A 42% growth rate validates some of that gap, but definitely not all of it.
Trailing free cash flow is negative USD 8.80B. At a deposit-funded lender, originations held for sale run through operating cash flow while the deposits funding them sit in financing. A lender growing originations at 69% will show deeply negative operating cash flow by construction. Judge this balance sheet on capital, funding cost, and credit, all of which improved.
Fundamental conclusion: The franchise is compounding faster than almost anything in consumer finance, credit is behaving, and funding keeps getting cheaper. What hasn’t arrived is operating leverage. Until net margin stops sliding or Galileo stops shrinking, 35x trailing earnings on a 6.2% ROE asks the buyer to underwrite a profit inflection that management itself declined to guide toward. The October print is the next chance to settle it.
Technical Analysis
Weekly Chart
Step back far enough and 2026 is one long repair job.
The high was 32.73, and then broke down to almost half by late March. Since then, it’s been oscillating between 14.88 and 20.13. The bottom end has been tested in 5 separate months, from March through July. The ceiling has held strongly, and there hasn’t been a weekly close above 20 since the first week of Feb 2026.
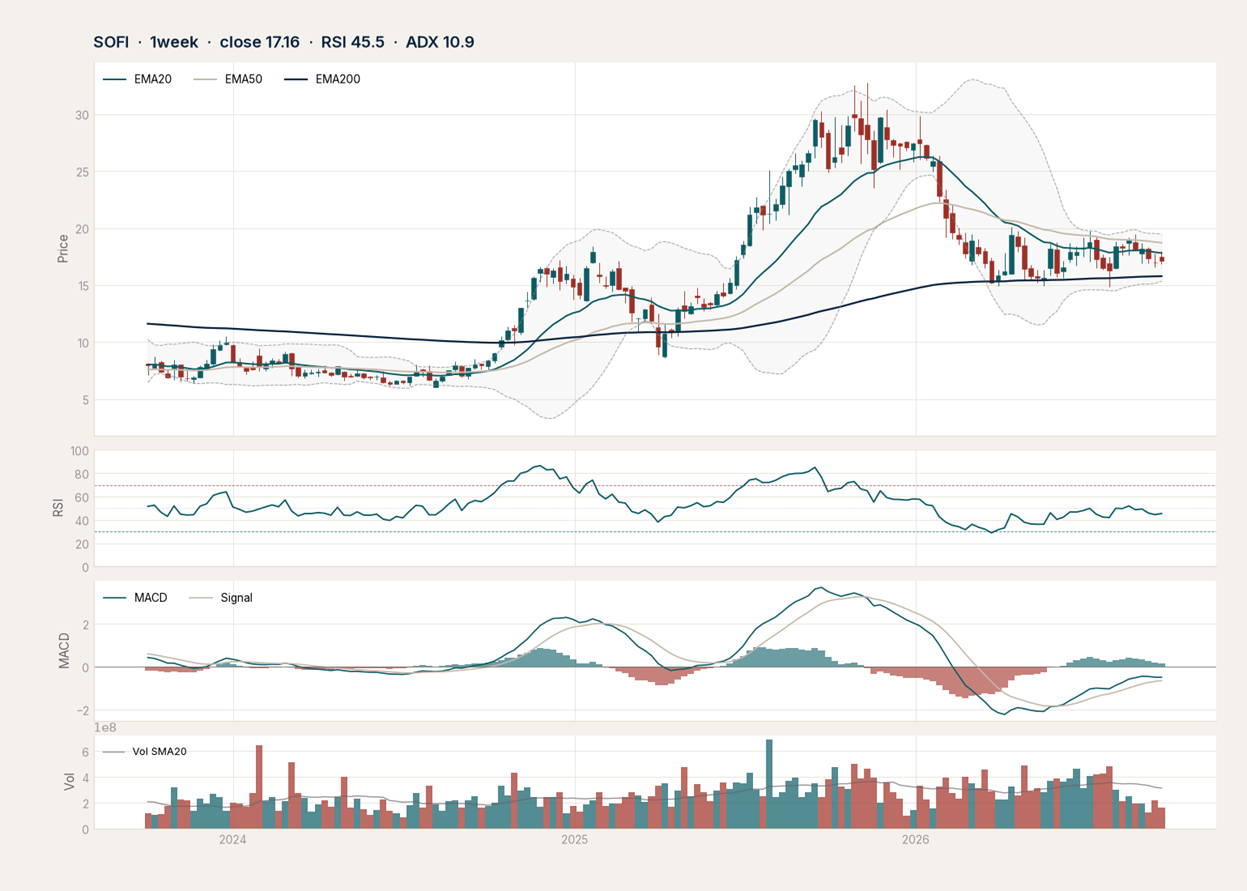
Trend strength is absent. ADX reads 10.9, and a trend-strength gauge below 20 says range-bound chop rather than directional trend. Breakout entries fail repeatedly in this regime.
Price is threading the long averages. The 20-week EMA, roughly 5 months of price, sits at 17.81. The 50-week, about a year, is 18.71. Both sit just overhead and both have flattened. The 200-week, close to 4 years of price, is 15.78 and rising into the range from below.
Momentum is improving from a deep hole. The weekly MACD line at minus 0.49 has climbed above its signal at minus 0.64, with the histogram positive at 0.15 and expanding, meaning downside momentum is fading even though the reading remains below zero.
The ceiling is higher than the range top. The weekly Ichimoku cloud, a shaded band that acts as trend-following support and resistance, sits at 20.67 to 22.36. Price hasn’t traded inside it since February.
RSI 45.5 is neutral, with no divergence either way. Weekly volume last week ran at about half its 20-week average, which is what apathy looks like.
A 6-month base holding above a rising 200-week average is good, but the weekly close pattern is not so good.
Daily Chart
The daily picture is tighter and currently tilted against buyers.
Price at 17.16 sits below all 4 daily moving averages, and they’ve bunched into a band barely 7% wide: the 20-day at 17.46, the 50-day at 17.62, the 100-day at 17.90, the 200-day at 18.72. Compression like that resolves eventually. It’s just hard to see which way it’ll resolve.
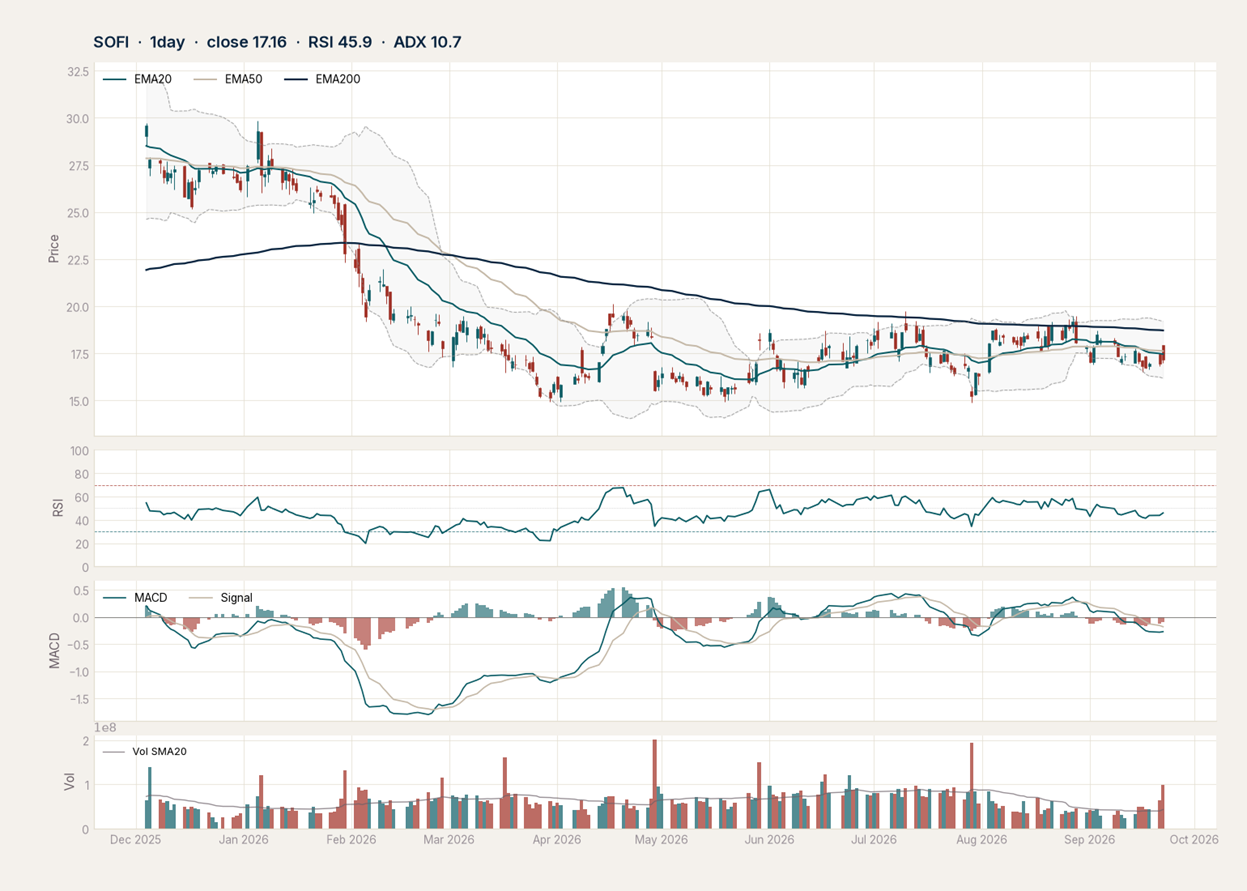
The August rally has rolled over. From the July 29 low of 14.88, shares ran to 19.50 by August 28, then made lower highs at 18.71, 18.35, and 17.96. The September lows have held a shelf at 16.53 to 16.83.
Momentum has turned down. The MACD line at minus 0.27 has slipped below its signal at minus 0.18, with the histogram negative at minus 0.09, so short-term momentum is softening rather than building.
The trend gauge is flat on its back. ADX 10.7 confirms the weekly read. No trend to trade, so mean reversion inside the range has better odds than chasing either edge.
Buyers haven’t actually left. Directional indicators sit at +DI 23.8 versus -DI 18.7, meaning buying pressure still holds a slight edge over selling despite the drift lower.
Short-term momentum has reset. StochRSI at 26 on the fast line is near the oversold floor and curling up, which is where bounces inside a range usually start.
Fibonacci confluence sits just below. Measured from the 14.88 low to the 20.13 high, the 0.618 retracement is 16.89 and the 0.786 is 16.00. The September base is sitting on the first of those.
Then there’s yesterday, September 22, which was quite an informative session.
SoFi announced that its entire USD 25B card program had gone live settling in stablecoin on Mastercard’s rails. That is a real catalyst. The stock opened at 17.93, hit 17.96, and closed at 17.16 on 98.9 million shares, roughly 2.3 times its 20-day average volume.
A genuine headline, heavy volume, and nearly the whole move sold by the close.
Technical conclusion: Both timeframes say pretty much the same thing. SoFi is moving in a range, and not trending either way really. The base held on 5 separaste occasions, so the floor is being defended. But the ceiling is also not caving in. The setup favors buying into weakness in the lower half of the range, and chasing breakouts might be beneficial under certain conditions where the price move above the major EMAs.
