
TechnipFMC (FTI): +60% and Still Running. Here's the New Trade Plan.
Three months, three targets blown through, a stock at all-time highs, market cap nearing $30B. And the setup isn't over.

If you've been with us since 2025, this one is for you.
First, thank you so much for reading and supporting us. We genuinely appreciate your interest, comments, and feedback! We look forward to giving you many more actionable analyses as the year progresses.
Second, you should already know how well FTI 0.00%↑ has performed since our first analysis in December, and how it continued to grow even after our follow up last month.
For those of you who haven’t seen those analyses, you can check them out below:


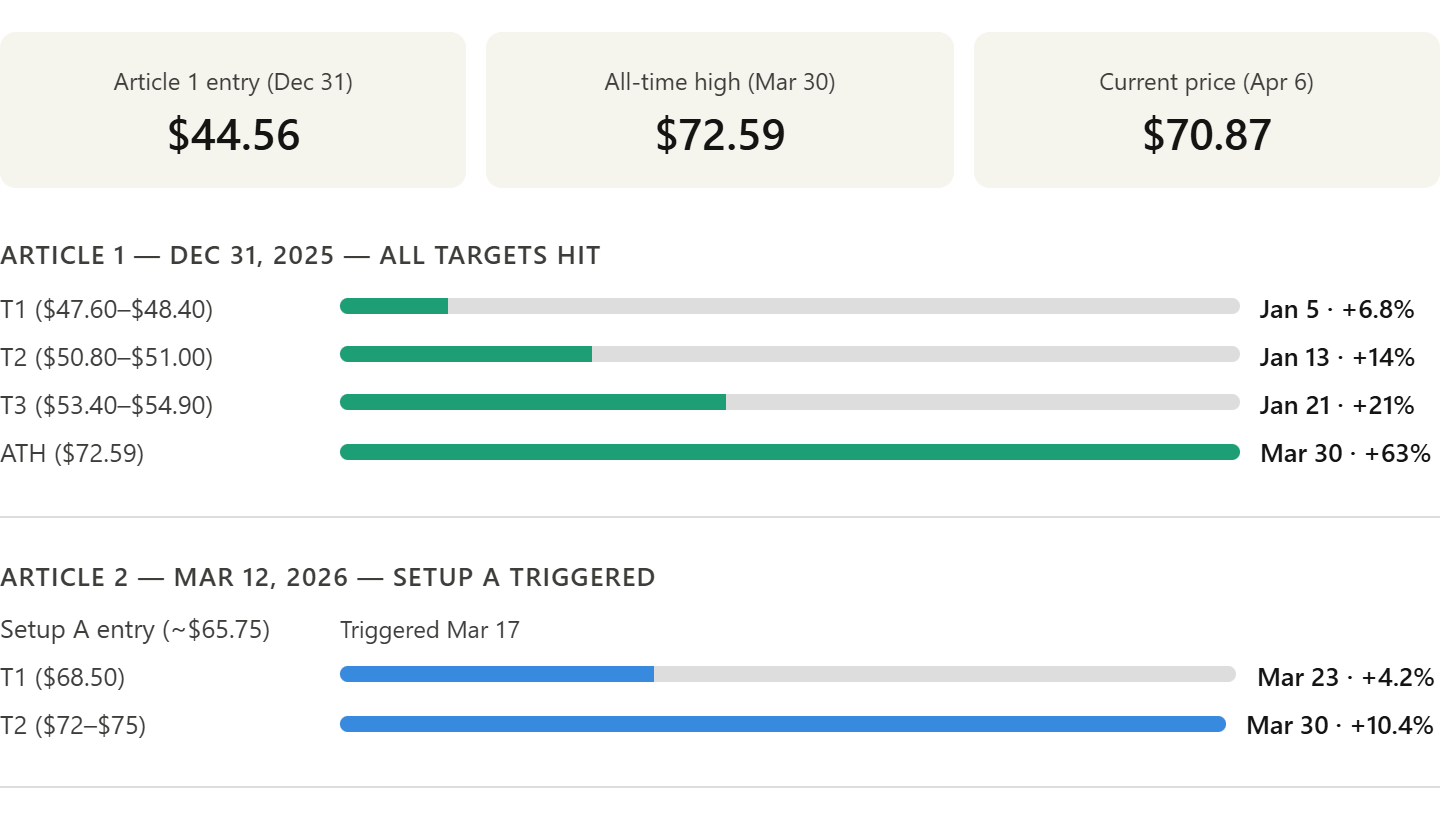
We called the entry at $44.56, mapped three specific targets, set our stops, and let the trade run.
All three targets hit within fifteen trading days.
The stock went on to reach an all-time high of $72.59, a 63% gain from entry, and as of today it's still trading at $70.87. We've been fans of this name since before it was obvious, and the thesis hasn't changed.
What has changed is the price, and that means the trade plan needs updating too.
Where We Stand
Let’s start with the numbers, because they deserve to be stated plainly.
In our initial analysis of FTI 0.00%↑, the stock was trading at $44.56 and was sitting in the middle of the secondary entry zone we had identified ($44.30–$44.60). Anyone who acted on that plan entered approximately at the right price, on the right day, and for the right reasons.
Since then:
Target 1 ($47.60–$48.40) was hit on January 5, 2026 (three trading days after the article).
Target 2 ($50.80–$51.00) was hit on January 13.
Target 3 ($53.40–$54.90) was hit on January 21 (fifteen trading days in).
The stock went on to reach an intraday all-time high of $72.59 on March 30, representing a peak gain of +63% from the December entry.
As of today, April 6, FTI 0.00%↑ trades around $71, still +59% from that original entry.
Our second article, published March 12, saw a breakout above $65.50, with targets at $68.50 and $72–$75. That trade returned approximately +8% from the $65.75 mid-entry, with the stock currently still well above the entry level.
Two articles. Two trade plans. Every target hit. The thesis has been confirmed at every step.
The question now is simple: where does the trade go from here?
What Has and Hasn’t Changed
The fundamental picture has not changed materially since March 12. TechnipFMC remains the same business we described then: a long-cycle offshore infrastructure company with a record $16.6 billion backlog, a $29 billion opportunity pipeline, net cash of $602 million, and 2026 guidance pointing to Subsea EBITDA margins of 21–22% (the highest in company history). Free cash flow guidance of $1.3–$1.45 billion for 2026 remains intact.
Quick Fundamentals Summary as of Q4 2025 / March 2026 Update:
Revenue: $9.93B for full-year 2025, up 9% YoY. Subsea alone: $8.67B
EBITDA: $1.82B adjusted, up 33% vs 2024. Subsea margins at 20.1%, up 340bps YoY
Free cash flow: $1.45B for the year, more than double 2024 levels
Balance sheet: Net cash of $602M. Total debt down to $430M. Essentially debt-free.
Capital returns: $1B returned to shareholders in 2025, 2x the prior year
Backlog: $16.6B, up 15% YoY. Multi-year revenue visibility through 2028
Opportunity pipeline: $29B on the Subsea Opportunities List, a company record
2026 guidance: Subsea revenue $9.2–$9.6B, Subsea EBITDA margins 21–22% (highest ever), FCF $1.3–$1.45B
Competitive moat: 80%+ of Subsea inbound in 2025 came via direct awards, iEPCI, and Subsea Services, not open bidding
At $44.56, this was an under-the-radar momentum setup.
At $70.87, it is a trend continuation trade at all-time highs.
That is a different animal.
The entry criteria are different, the risk management is different, and the patience required is different.
Technical Picture
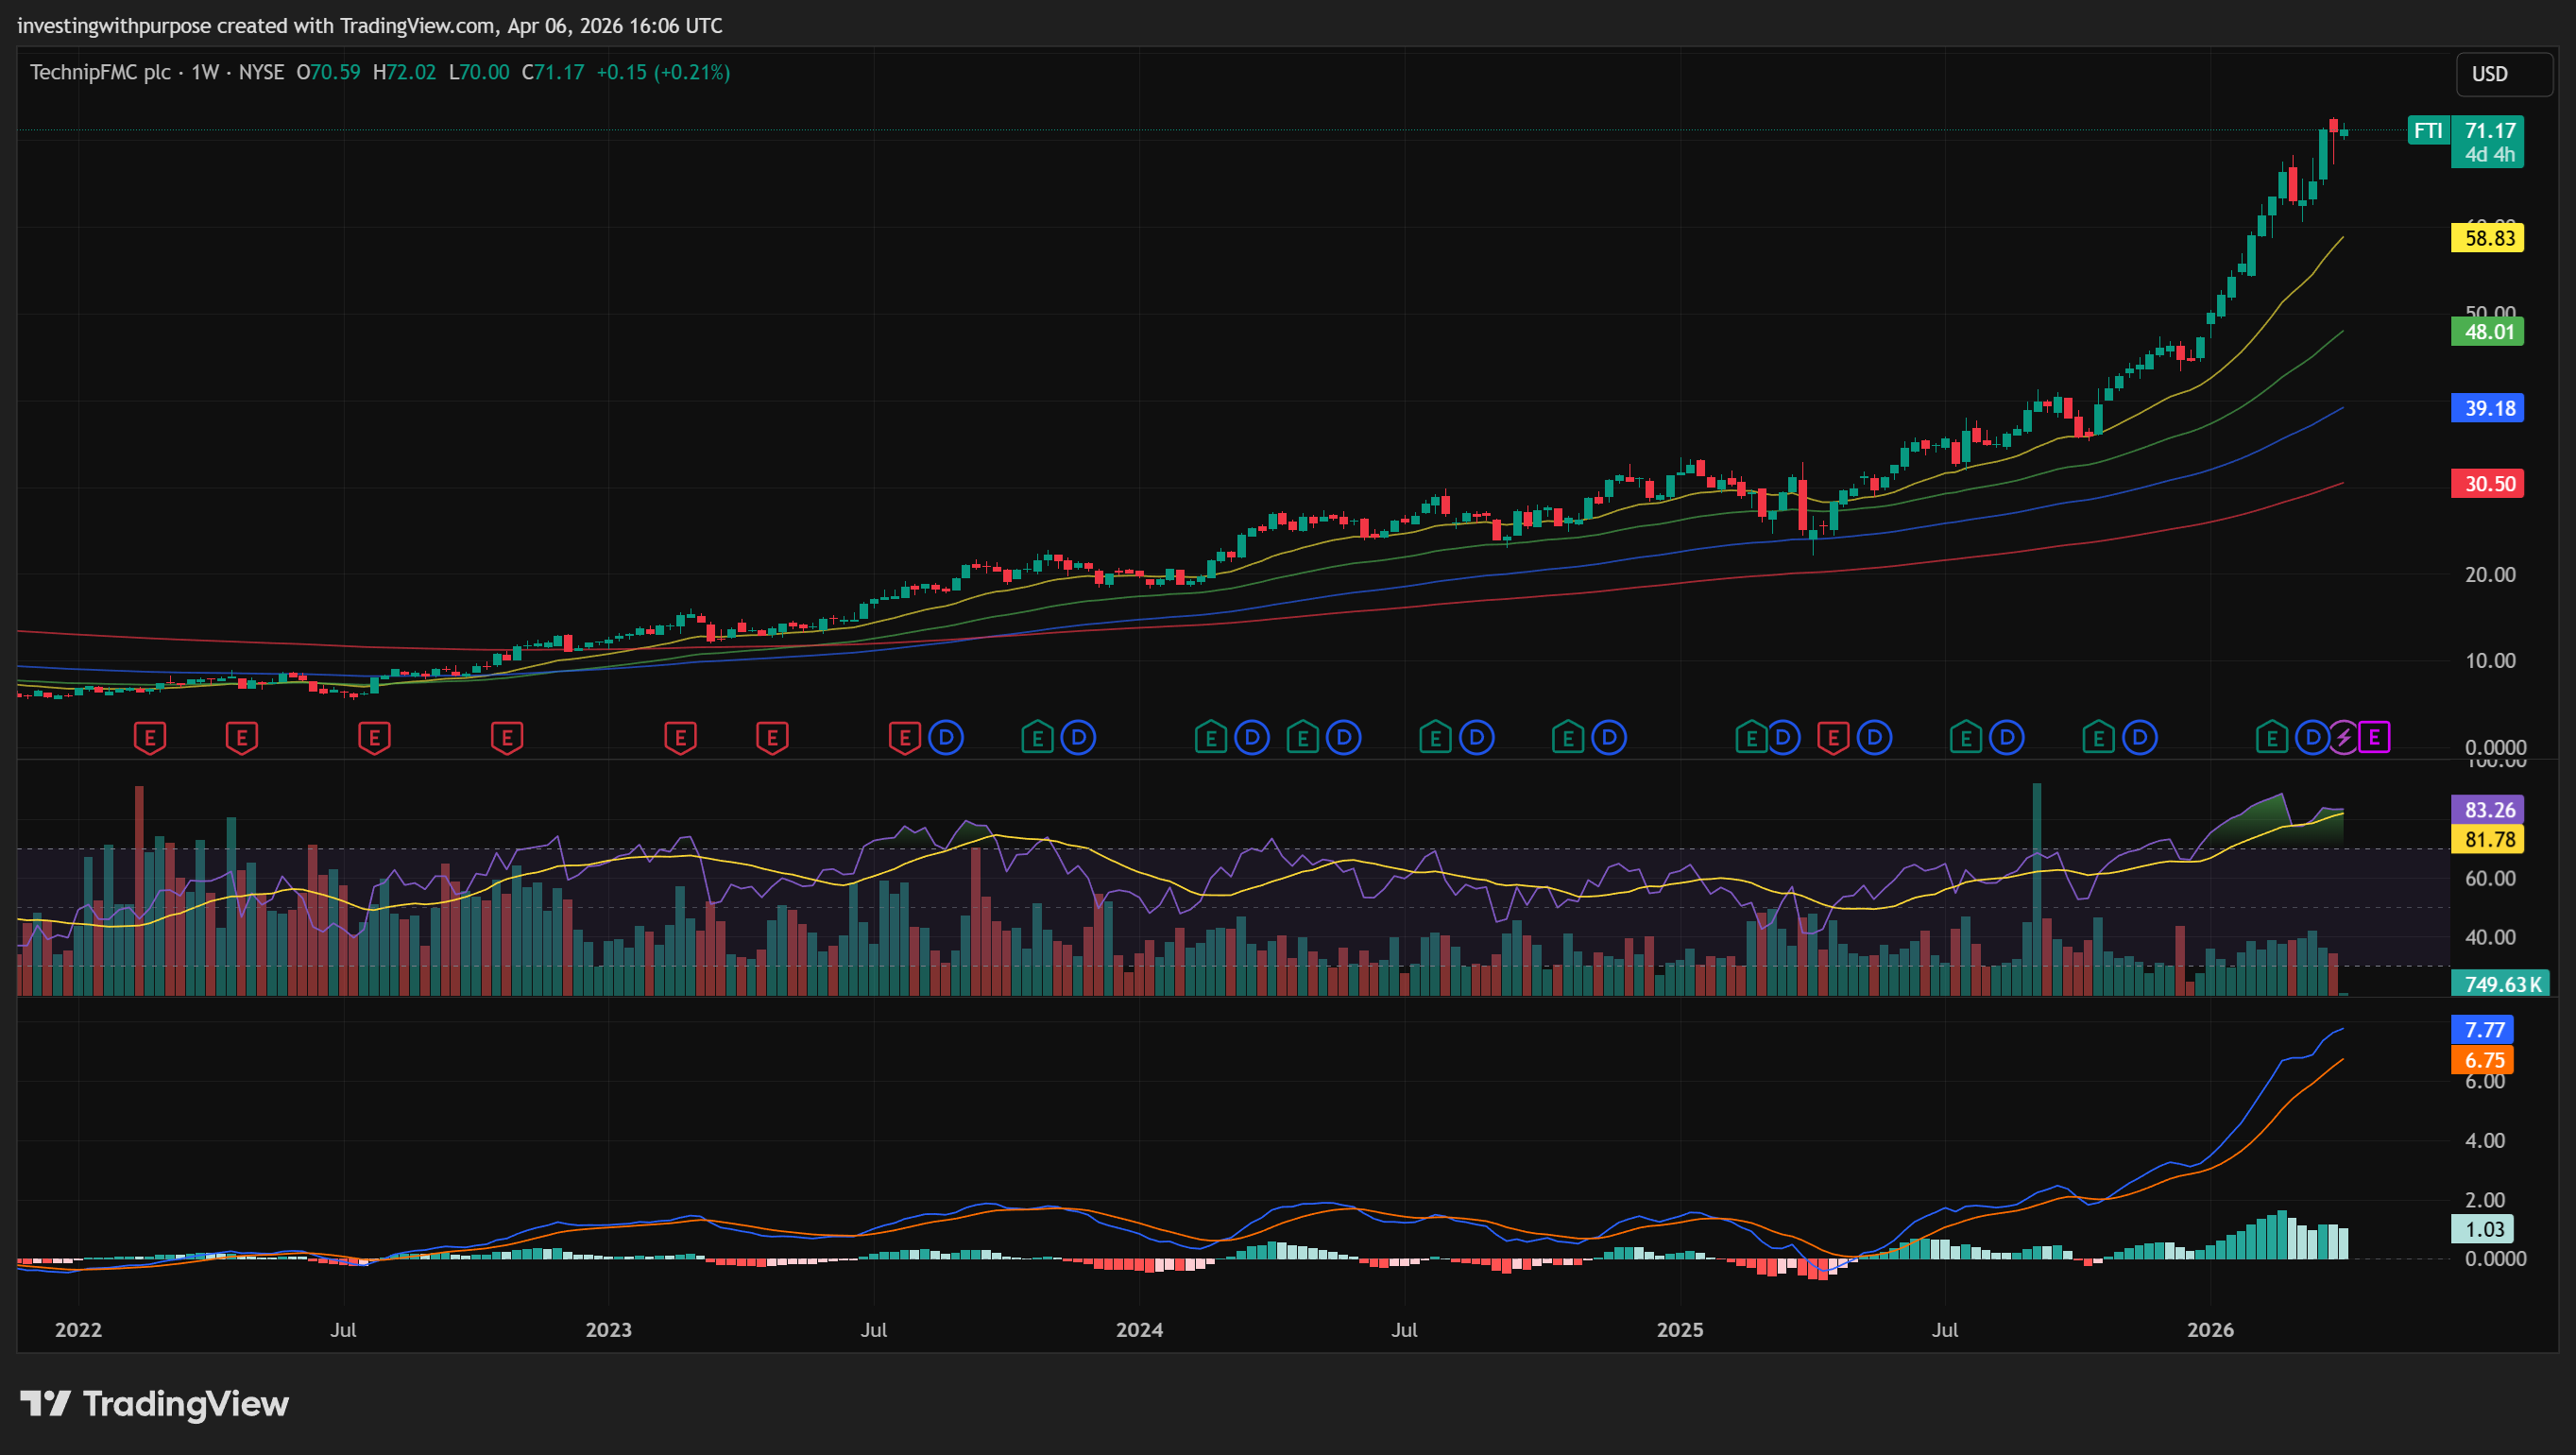
Weekly (structural view):
Price at $70.89, well above all major EMAs: 20W at $58.81 → 50W at $48.00 → 100W at $39.17
Weekly MACD: 7.75, above signal (6.74), histogram rising, no exhaustion signal
Weekly RSI: 82.7 - elevated and extended. Has been above 75 for weeks. This doesn’t mean the trend breaks, but it does mean mean-reversion risk is real. A pullback to reset RSI toward 60–65 would be completely healthy and normal.
Structural trend invalidation: weekly close below $58.81 (20-week EMA)
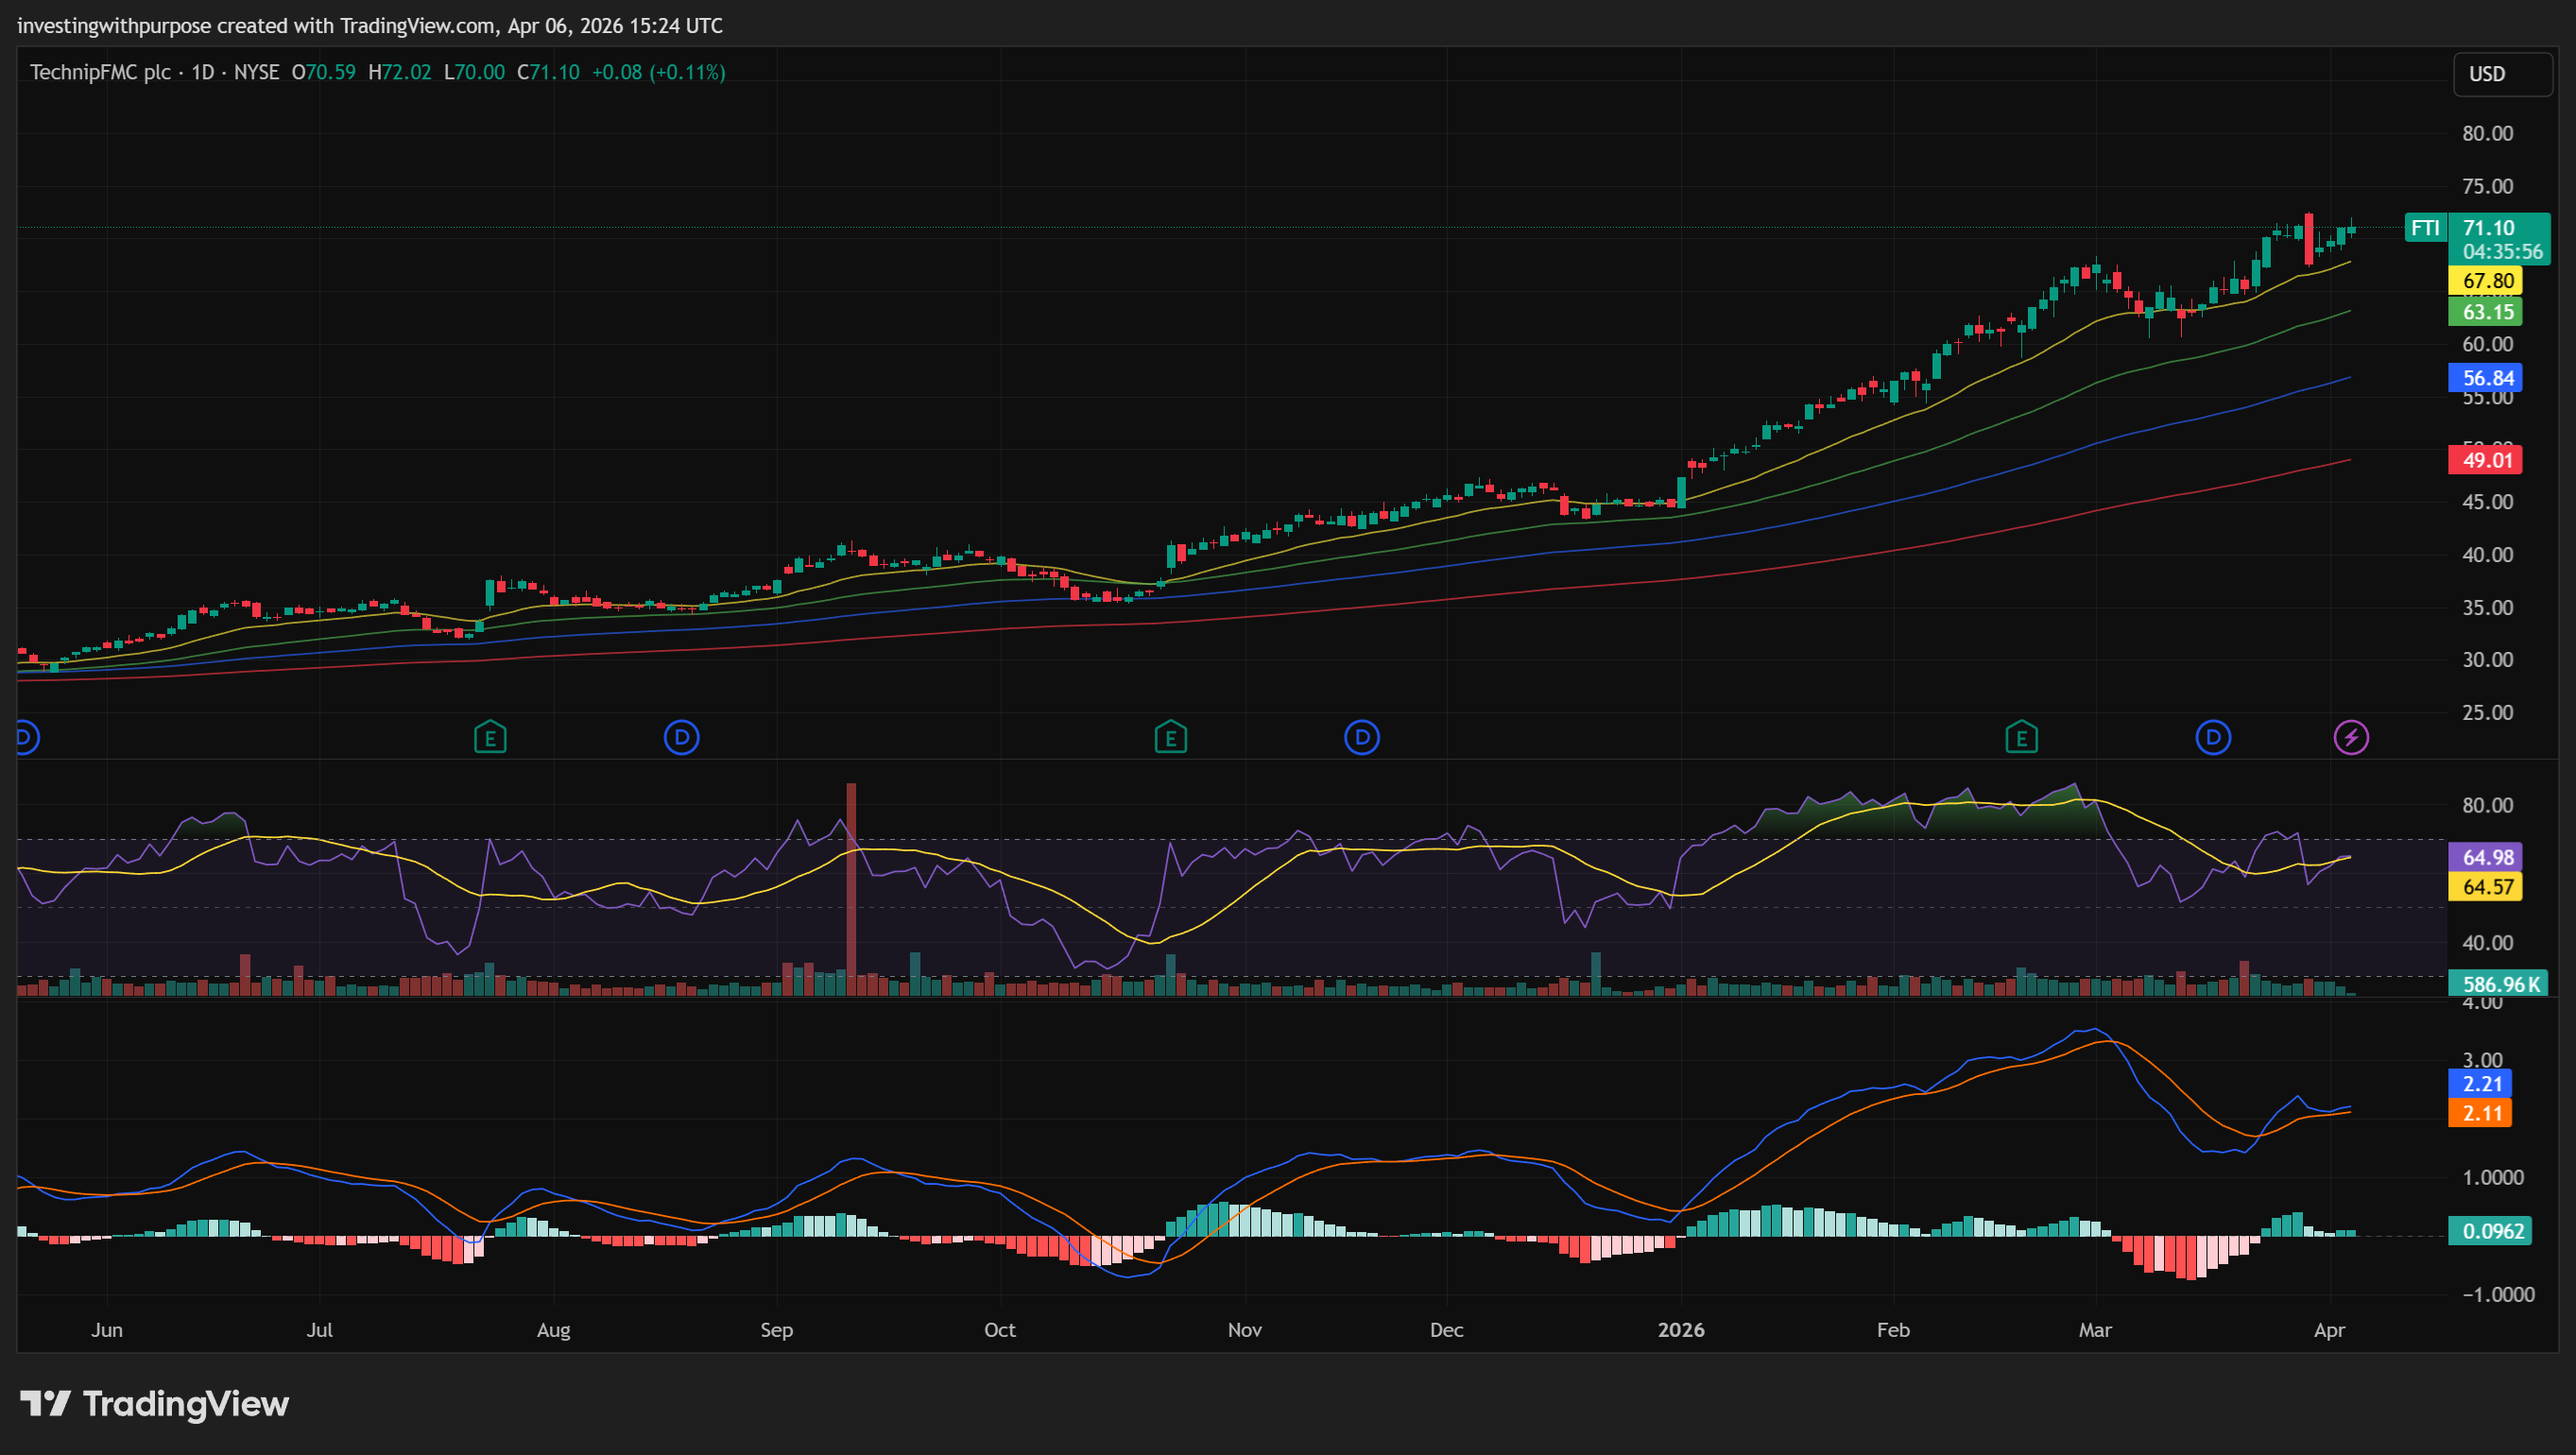
Daily (trade management view):
Price above 20-day ($67.78), 50-day ($63.14), 100-day ($56.83), 200-day ($49.00) — all rising
Daily MACD: 2.19, above signal (2.11), histogram positive
Daily RSI: 64.2. Healthy, not extended, room to run
ATR: $2.41 (≈3.4% daily range) - factors into stop placement
Note: March 30 printed a spike high to $72.59 with a large intraday reversal, that level is a clear resistance that needs to be absorbed before a clean break higher
Intraday:
The intraday structure is not showing distribution. It is showing a measured retest of the all-time high zone with controlled price behavior on both sides of the test.
Technical Conclusion: Trend intact on all timeframes. Weekly RSI extended. Daily structure clean. ATH resistance at $72.59 needs to be broken or respected. Patience and level discipline are the edge here, not momentum chasing.
Trade Plan
If You’re Already Holding (from Dec or Mar entries)
You are carrying a 40–60% gain. The structure no longer supports holding full size without a plan.
Trim zone: $72.40–$74.00. Reduce size on any push into or through the ATH. Lock in a portion. You don’t have to exit, just right-size for the next phase.
Hold the core with a trailing stop at $67.50 (just below the 20-day EMA). Every major pullback in this rally has been bought at the 20-day. A daily close below it, with MACD turning negative and RSI breaking below 55, is the signal to cut the remainder.
If stopped out, reload zones:
$67.50–$68.50 (20-day EMA)
$63.00–$64.50 (50-day EMA - deeper reset, cleaner entry)
Structural exit: Weekly close below $58.81 ends the thesis entirely.
If You’re Starting Fresh (new position)
Buying at all-time highs without a plan is how good fundamentals turn into bad trades. Two setups worth waiting for:
