
TSMC, Samsung, Intel: Three Semiconductor Giants, One Massive Investment Opportunity
A deep dive into the manufacturing giants powering the global semiconductor supply chain.

Every major technological shift has a backbone. During the PC boom it was Intel. In the smartphone era it was TSMC. Now, in the era of AI acceleration and data-center expansion, the entire semiconductor ecosystem is being reshaped by capacity constraints, geopolitical realignment, and insatiable compute demand.
Investors feel the urgency. Cloud providers can’t build data centers fast enough. Chip designers are racing to tape out new architectures. Governments are offering subsidies at a scale we’ve never seen. And underneath all of it are three companies holding up the world’s computational sky.
This post breaks down TSMC (TSM US) , Samsung (SMSN LN GDR) , and Intel (INTC US) : where they truly stand today, how the environment is shaping their futures, and what the charts say right now. The aim is clarity and confidence, even for readers who don’t live and breathe semis.
Key Takeaways
AI demand has turned leading-edge semiconductor supply into a multi-year bottleneck.
TSMC remains far ahead on process leadership, profitability, and long-term visibility.
Samsung is entering the strongest memory up-cycle since 2018, with HBM demand acting like a structural tailwind.
Intel has stabilized its core business but still faces the most complex and binary path forward.
Technicals across all three names show bullish long-term regimes, but each sits at a very different tactical spot.
Macro trends: cloud capex, rates, subsidies, geopolitical diversification; matter just as much as fundamentals.
Pipelines, Environment, and What’s Driving Growth
There’s no semiconductor cycle without context. And the current backdrop is unusually powerful.
AI infrastructure is the dominant driver
Both Nvidia and AMD are supply constrained across their highest value products. Every H100, H200, MI300, MI400, Blackwell, and custom AI ASIC pulls directly from the most advanced node capacity available. For years, that capacity came primarily from TSMC. Now Samsung and Intel are fighting to claim a slice of that demand.
Reshoring and security-driven manufacturing
The US, Europe, Japan, and Korea are throwing tens of billions at domestic manufacturing.
This is good for Intel and Samsung, vital for TSMC, and a long-term ballast for the sector.
HBM is rewriting the memory cycle
AI accelerators need enormous bandwidth. That means stacks of high-bandwidth memory (HBM). SK hynix leads the category, Samsung is racing to catch up, and Micron is not far behind. This is one of the rare cycles where memory is a secular winner.
Consumer stabilization
PC and smartphone units have stopped contracting. They’re not booming, but they’re no longer a drag. That removes a headwind the industry lived with for nearly two years.
Energy and infrastructure limits
Even if fabs expand, power grids, water rights, and ASML tool availability remain bottlenecks.
This is partly why margins for the leaders have remained elevated; the supply ramp is slower than the demand ramp.
Fundamental Analysis
TSMC (TSM)
TSMC isn’t just the leader. It’s the global choke point for advanced chip production.
Its last four quarters show a powerful re-acceleration:
Revenue growth around 39 percent year over year
TTM revenue in the 115 to 120 billion dollar range (company reported in NT$ but USD conversion steady)
Gross margin near 59 percent
Operating margin near 50 percent
Net margin above 40 percent
Free cash flow margin in the low 20s
Net cash position above 55 billion dollars
More than 60 percent of revenue from AI/HPC
Roughly three quarters of revenue from 7nm and below
These are elite numbers. No other manufacturer; not Samsung, not Intel, is close on combined scale, margin, and mix.
TSMC’s biggest risk is geopolitical concentration. Its biggest strength is that its customers depend on it more than it depends on any single customer.
Samsung Electronics (SMSN LN)
Samsung is a diversified giant: memory, foundry, smartphones, appliances, displays. But the story investors care about today is memory, especially HBM.
Semiconductors are entering an up-cycle, and the memory segment is in early innings:
TTM revenue above 220 trillion KRW
TTM gross margin in the mid 30s
Operating margin near 10 percent but rising quickly
FCF margin near 9 percent
Net cash position above 60 trillion KRW, a massive war chest
Record foundry backlog, though profitability still trails TSMC
Strong Q3 rebound: more than 12 trillion KRW in operating profit, with semiconductors regaining momentum
Heavy investment in HBM3E and HBM4 capacity
Aggressive 3nm GAA and 2nm process development
The big question is simple: Can Samsung close the HBM gap with SK hynix? If yes, earnings power moves meaningfully higher.
And in smartphones and displays, Samsung continues to print reliable cash flow even in slow cycles.
Intel (INTC)
Intel’s story is no longer a collapse. It’s a fragile stabilization carrying a very heavy strategic load.
Recent financial trajectory:
Quarterly revenue holding around 13 to 14 billion dollars
Non-GAAP gross margins back near 40 percent
Adjusted free cash flow positive
CCG growing as AI PC refresh gets underway
DCAI earnings up materially as Xeon 6 gains traction
Gaudi 3 is competitive on cost per token but not yet mainstream
Foundry still losing more than 2 billion dollars per quarter
Debt around 50 billion dollars
Cash around 29 billion dollar
Credit rating hovering at BBB with negative outlook
Intel’s turnaround leans heavily on:
Xeon 6 winning back share
AI PCs scaling
Gaudi 3 gaining traction
Foundry attracting real third-party customers
CHIPS Act subsidies closing the funding gap
Successful ramp of 18A and meaningful customer adoption by 2027
If Intel delivers, it becomes a strategic asset for the West with a re-rate ahead.
If not, the company defaults back to being an aging CPU franchise with stranded fabs.
Technical Analysis
TSMC
TSMC’s chart represents what a strong uptrend looks like:
Price sits well above its rising 20, 50, 100, and 200 day EMAs
Weekly EMAs are cleanly stacked upward
The correction from 311 held perfectly at the 0.382 levels on multiple timeframes
Daily trend has reset higher with MACD turning positive and RSI back above 50
Weekly RSI still in a bullish band between 60 and 70
OBV rising with price: no divergence
Ichimoku cloud acting as dynamic support
Key support sits at 277 to 283
A weekly close above 305 opens the door to 311, then 330 to 380 extensions
This is one of the cleanest charts in the sector.
Samsung
Samsung’s technicals are the picture of a strong impulse with healthy digestion:
Weekly trend sharply up with price riding above Tenkan and Kijun
Cloud support sits near 1600
The pullback to 1575 created a textbook higher low
Daily chart shows a rising 20 and 50 day EMA providing support
RSI reset from overbought and found footing above 50
OBV flat during the pullback, now turning up
Price currently oscillating around the 61.8 retrace of the correction
A break above 1766 sets up 1810 to 1880
A break above 1950 activates wave: five targets into the low 2000s
Samsung’s chart blends cyclical strength with structural bullishness.
Intel
Intel’s technicals are far more nuanced:
The stock completed a five-wave advance from 19 to 42
The drop to 33 was the A:wave of a classic ABC correction
The current rally into 40 to 41 retraces 78.6 percent of the A:wave
That’s high-probability B:wave territory
Daily RSI and StochRSI are overbought
Intel needs a decisive move above 42.5 to negate the ABC and start a new trend leg
If it fails, downside into 38, 37, or even 33 remains open
Weekly trend is still bullish, but daily is tactically stretched
Intel’s chart isn’t bearish : it’s fragile.
Patience is key here.
A Simple, Risk-Aware Trade Approach
This isn’t about prediction. It’s about having a plan you can actually execute, one that keeps you disciplined whether the market behaves or not.
Here’s how to think about TSMC, Samsung, and Intel using clean levels, defined risk, and strategic patience.
TSMC (TSM)
Profile: Structural leader, strong trends, shallow pullbacks.
Approach: Buy the dips in strength. Avoid chasing extended candles.
Primary Entry Zone: 281 to 287 Daily 20 and 50 day EMAs, prior breakout shelf, and the heart of the recent consolidation. This is where strong hands typically step in.
Alternative Deep Entry: 270 to 273 A high - value area sitting right on the weekly mid-band and the next major Fib cluster. This is the “only if the market gifts it to you” level.
Stop Loss: Below 268 A break under this region means the bullish rhythm is no longer intact and a deeper weekly reset is likely.
Upside Targets
303 to 305 : first major test and the ceiling of the recent consolidation
311 : prior high and psychological trigger
330 to 345 : intermediate extension zone
370 to 385 : long-term structural target if the weekly trend continues

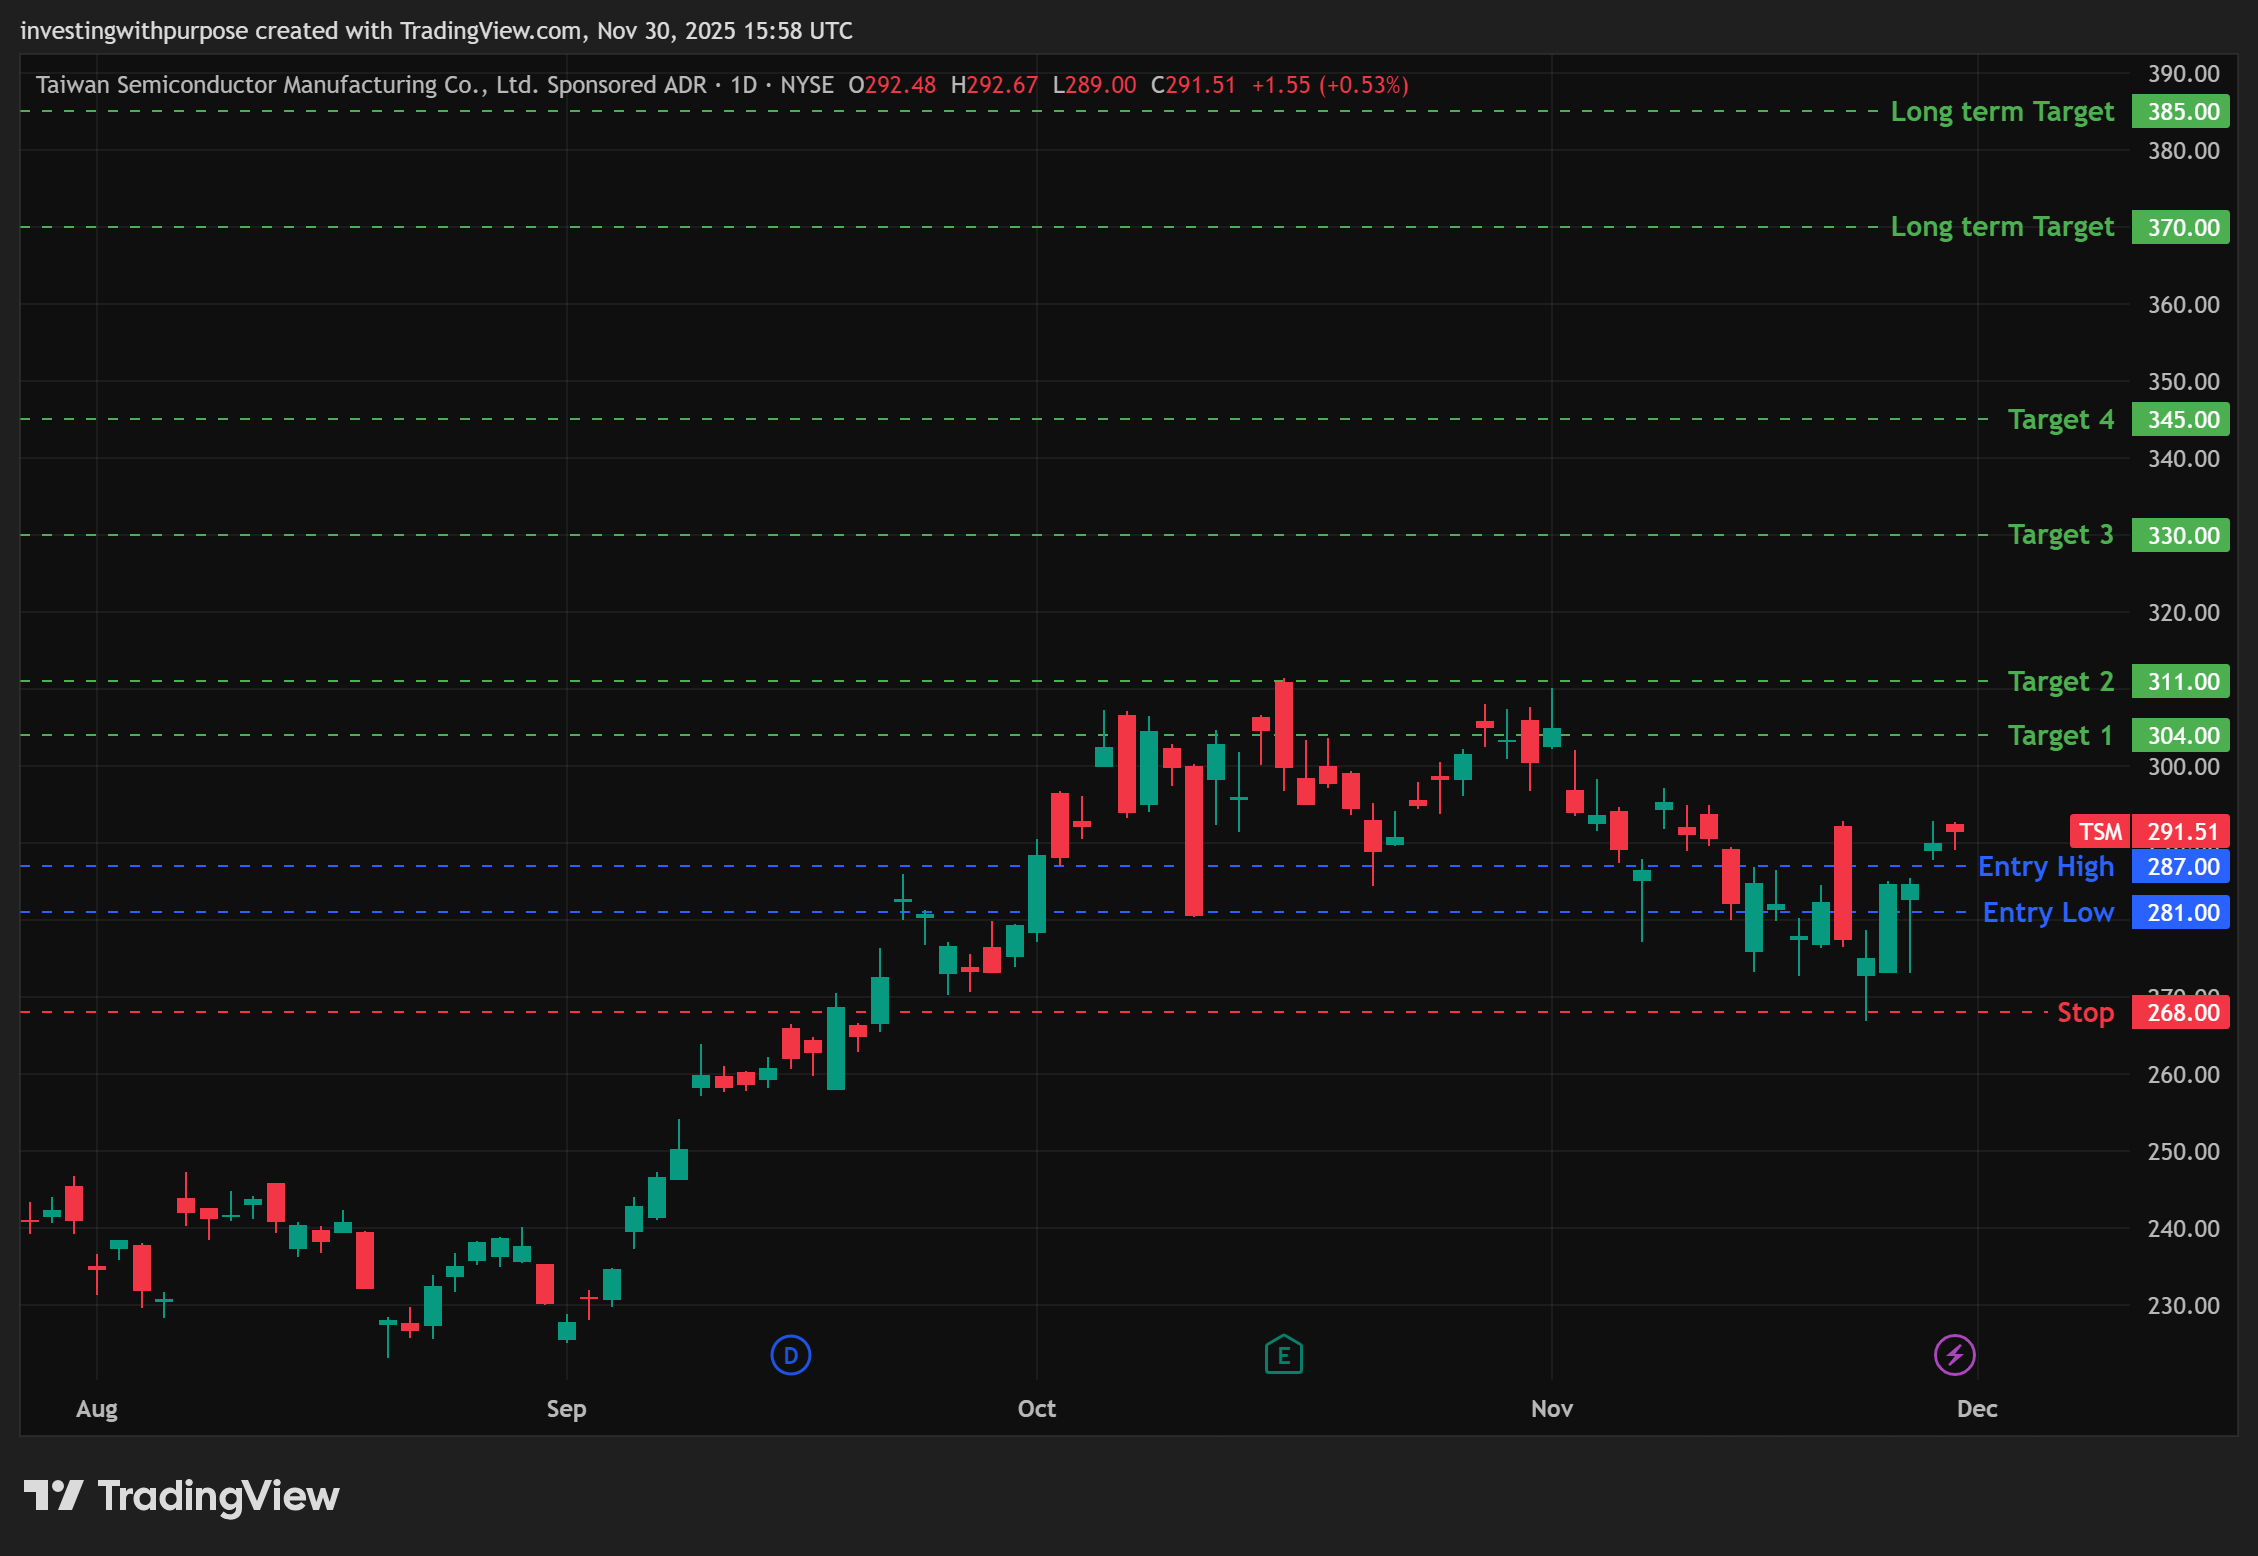
Trade Logic: TSMC is trending cleanly and respects high-timeframe support. The key is buying strength on pullbacks, not breakouts after the move has already run.
Samsung Electronics (SMSN LN)
Profile: Strong weekly impulse, healthy corrective behavior, rising trend anchored by AI-driven memory cycle.
Approach: Let the trend carry you, and use pullbacks toward the rising spine of the move.
Primary Entry Zone: 1690 to 171 This bracket captures the 20 day EMA, 4h EMA cluster, and equilibrium of the current range.
Secondary Entry Zone: 1640 to 166 Deep retracement level aligned with daily Fib support and the top of weekly cloud structure.
Stop Loss: Below 1570 That level breaks the wave:4 structure and signals a shift from controlled digestion into a deeper cycle reset.
Upside Targets
1765 : near-term trigger
1815 : first extension
1845 to 1880 : strong confluence band
1950 : prior major high
2050 to 2230 : wave-five projection for longer-term traders
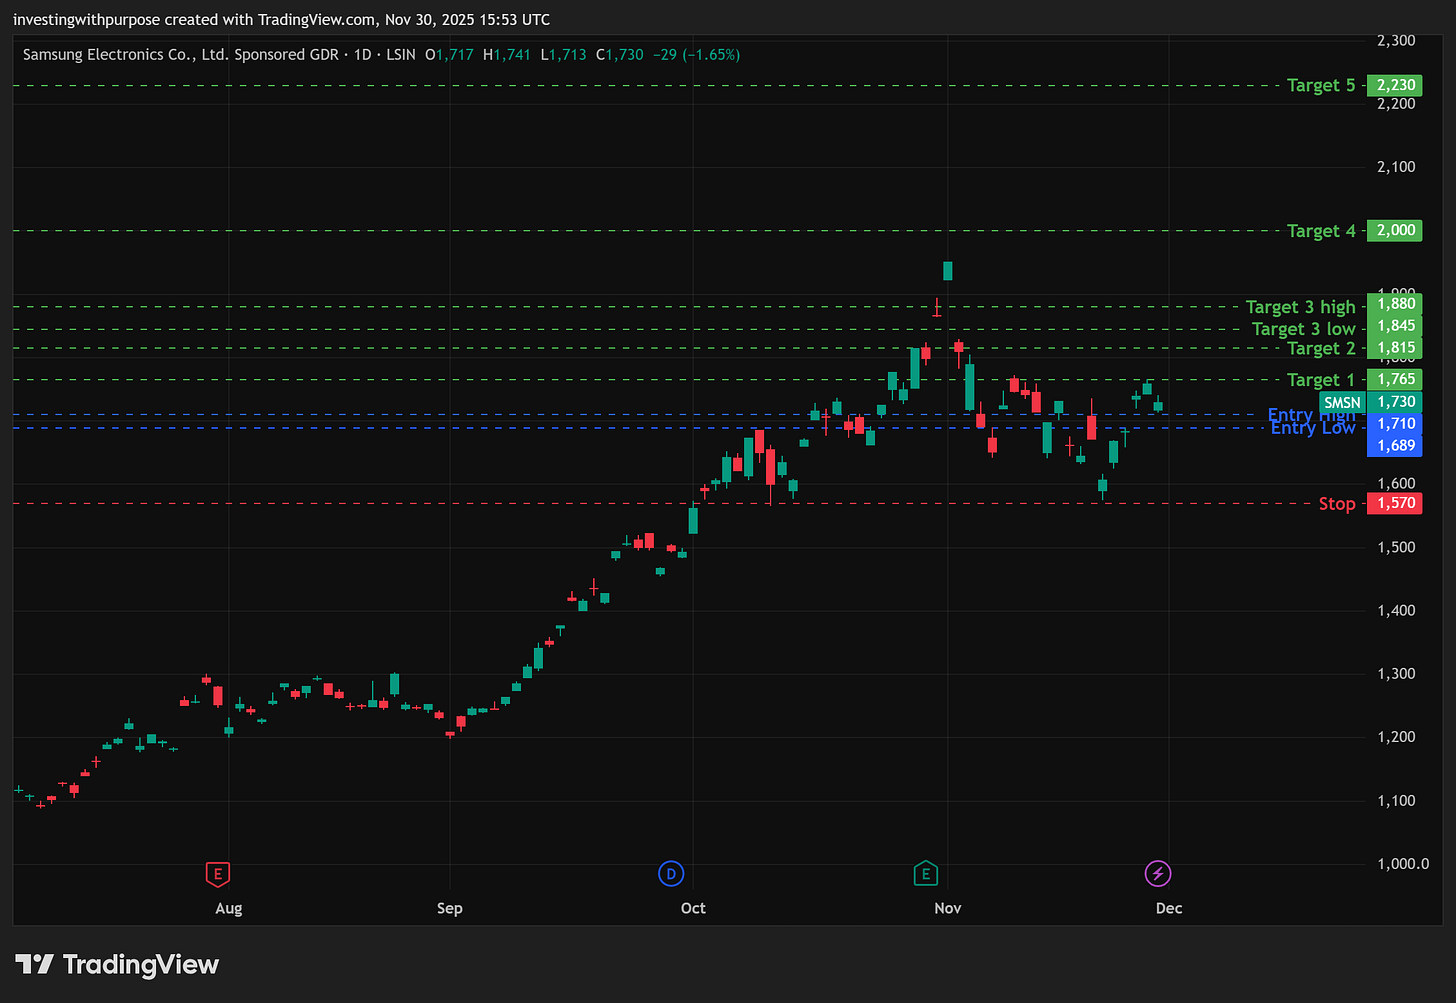
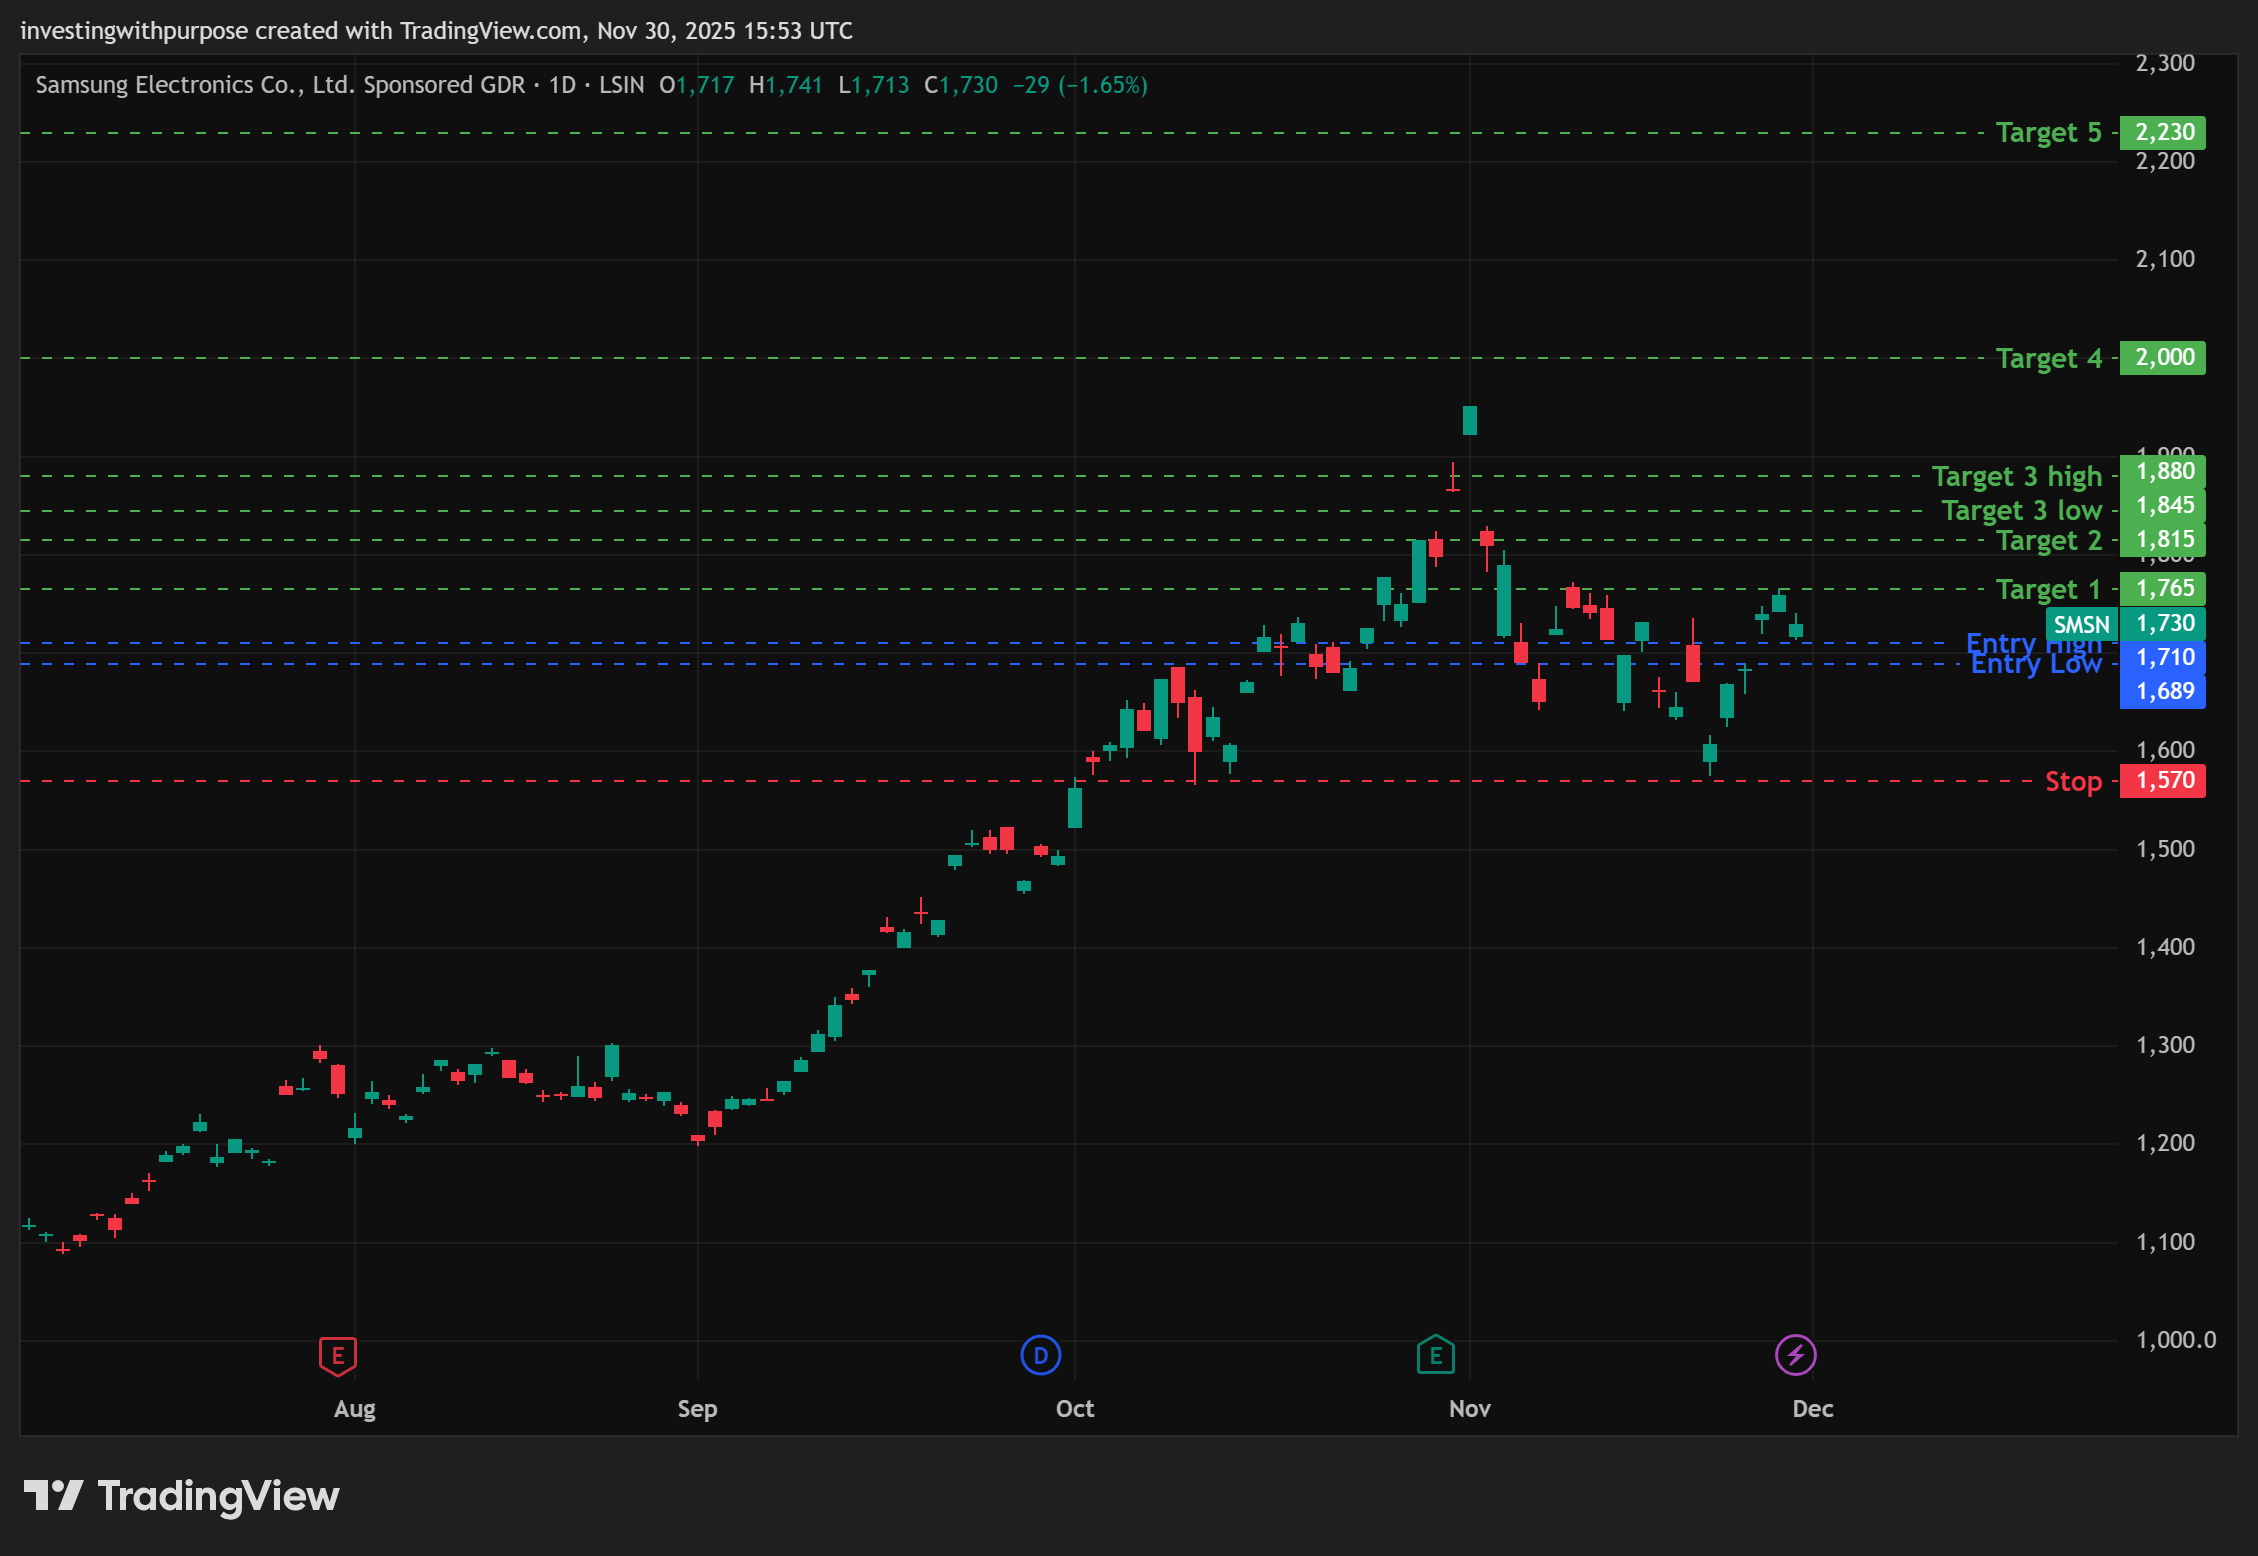
Trade Logic: Samsung’s trend is powerful but not parabolic. Buying into the rising base is far safer than chasing strength. This is a trend you ride : not force.
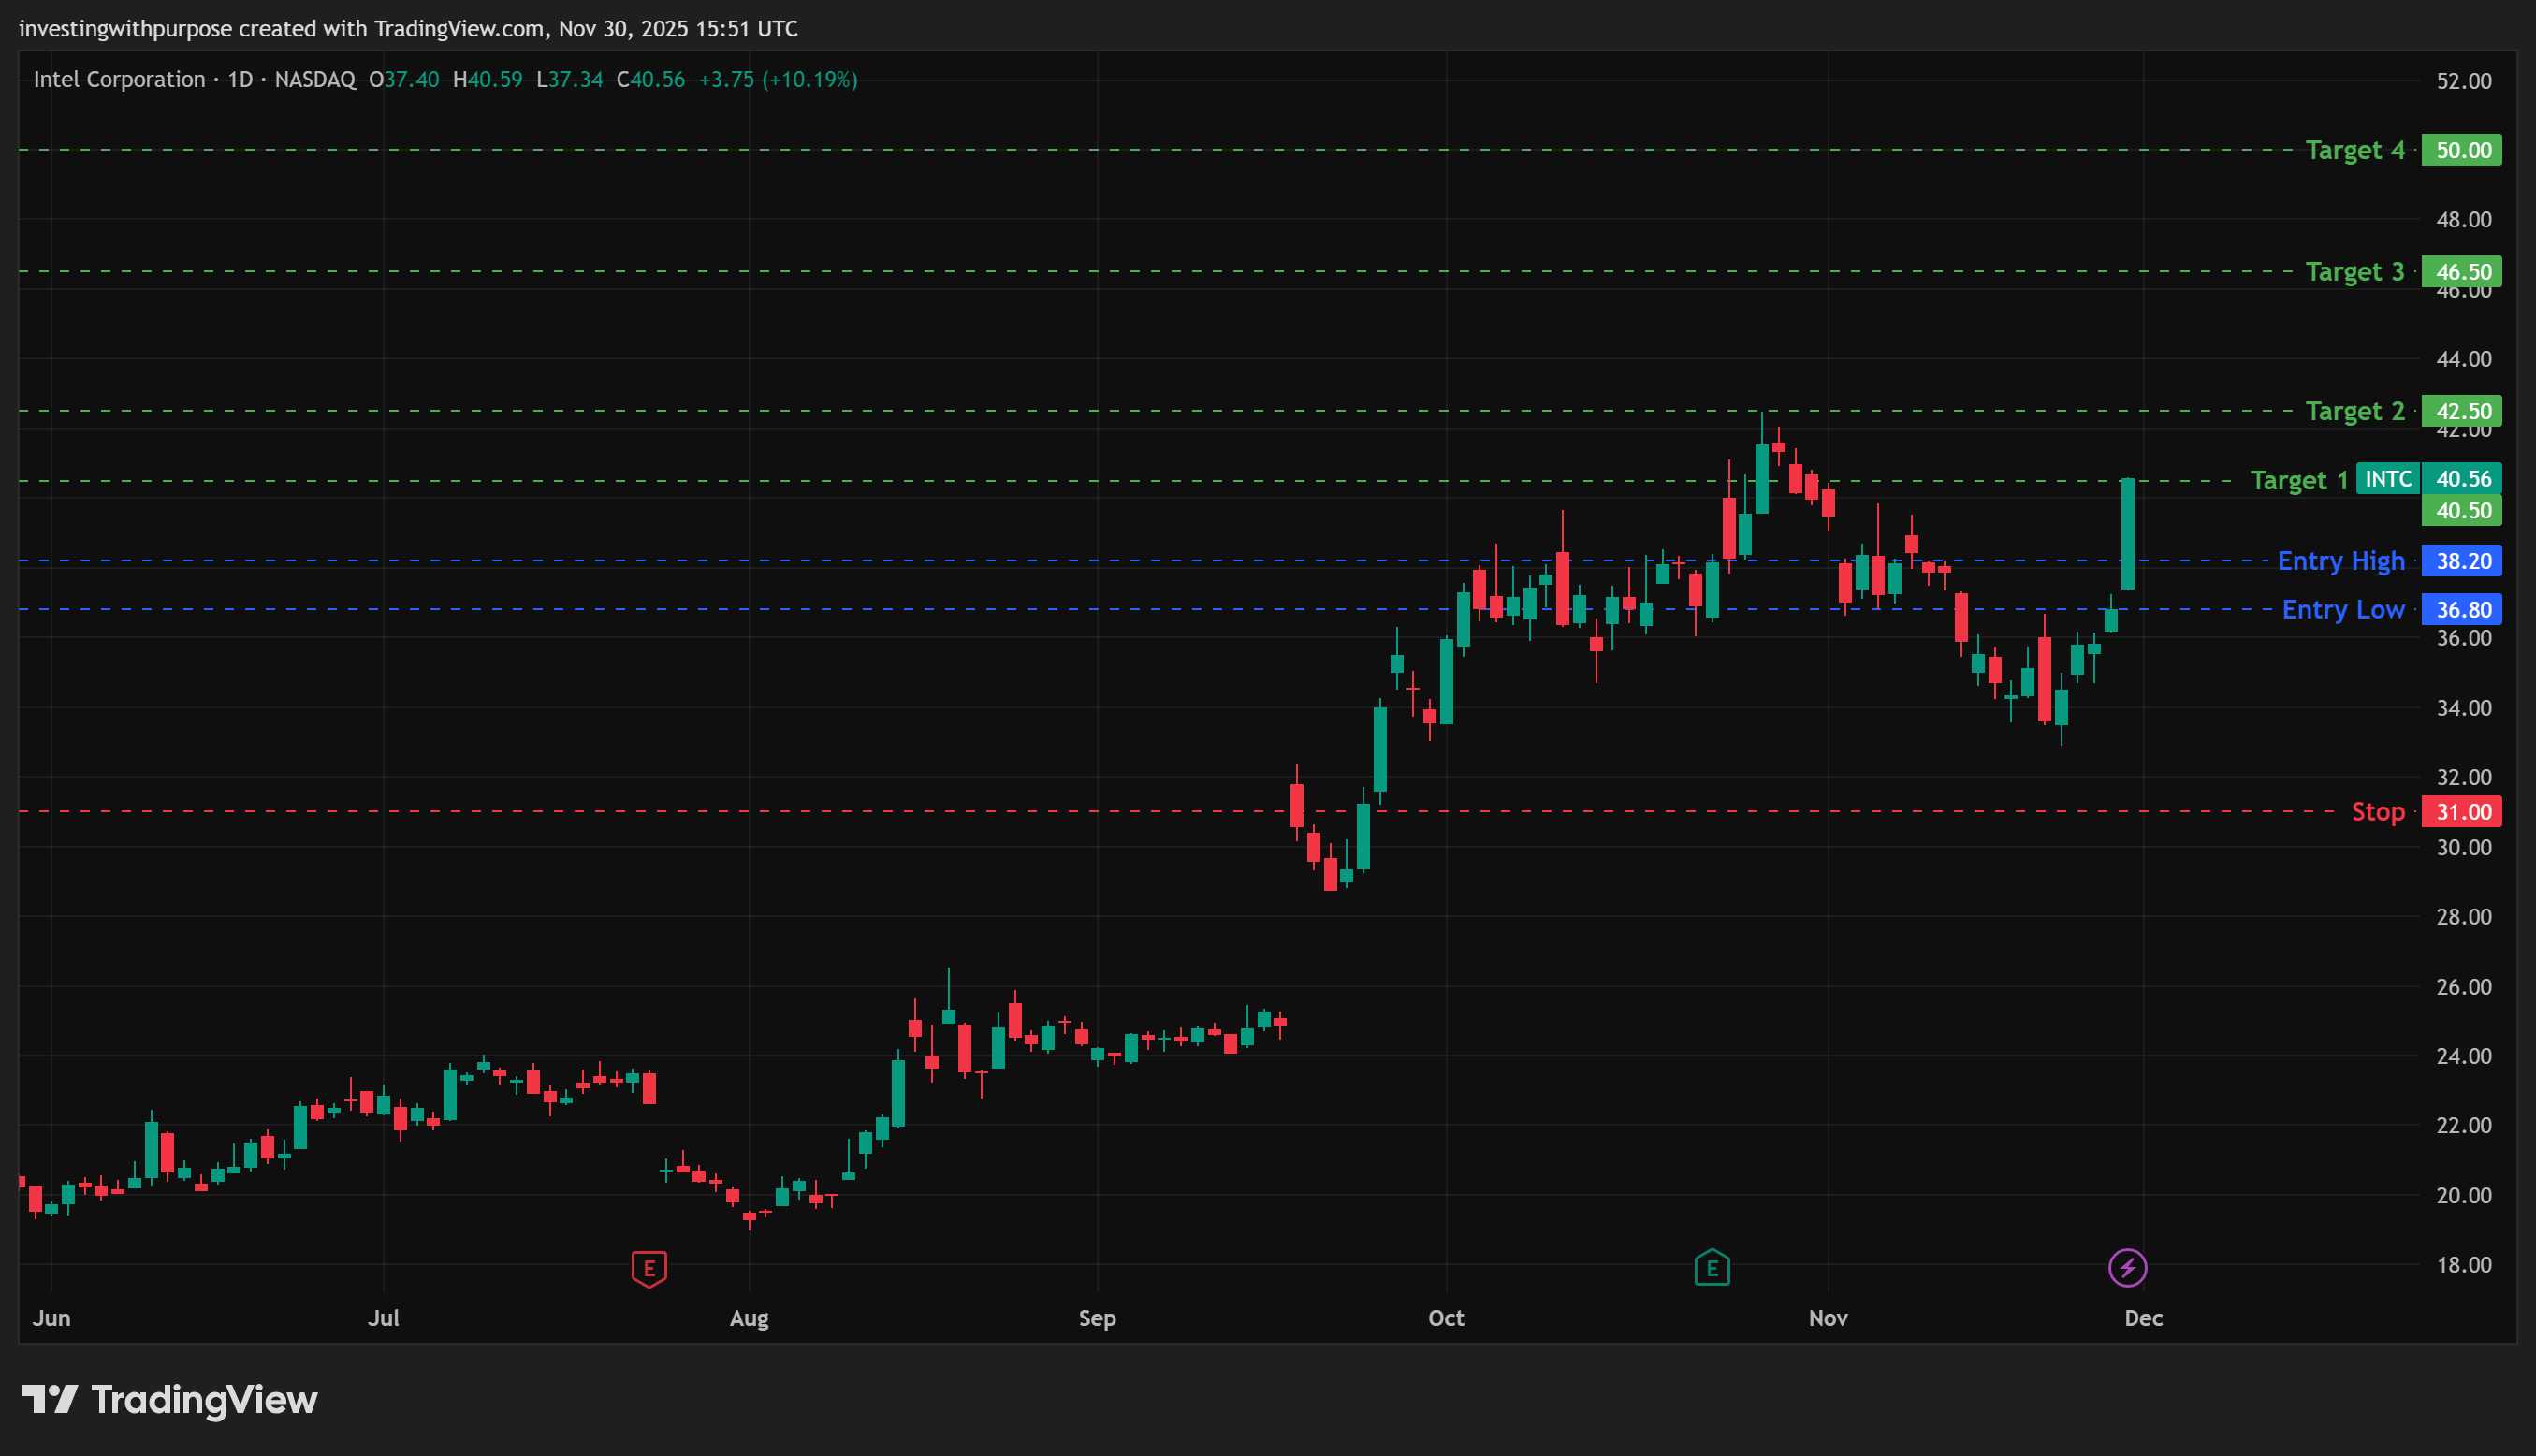
Intel (INTC)
Intel is tactically stretched and fundamentally in a fragile-but-improving phase.
The best approach is to let price come back to you and then ride the next leg higher, without guessing whether the breakout or correction resolves first.
This is the cleanest way to navigate a name that’s trending long-term but choppy short-term.
Entry Zone: Buy between 36.80 and 38.20 This zone is the “optimal risk spot” because it captures:
• The 20 and 50 day EMAs
• The heart of the 4h trend spine
• The natural retracement after the recent overextended rally
• The area where B-waves typically resolve into higher lows
Intel rarely trends smoothly.
This zone gives you the highest probability of buying a higher low instead of a top.
Stop-Loss: Place the stop at 31.00
Below 31, Intel breaks the corrective structure and signals a deeper cycle reset.
You don’t want to be long if the stock loses that level, it means the trend has meaningfully changed.
This stop is wide enough to avoid noise, tight enough to protect capital.
Targets:
Target 1: 40.50 This is the natural first reaction as intel bounces out of the retracement. Partial profit here helps reduce risk quickly.
Target 2: 42.50 This is the major structural lid. If Intel can finally clear it, the uptrend confirms. Take another partial here to lock in the win.
Target 3: 46.50 If Intel breaks 42.50 with strength, momentum usually carries it into the 1.272 extension. This is the key swing target.
Target 4 (optional long-term)” 49 to 50 This area lines up with the 1.618 extension and psychological resistance. Use this only for the remaining runners.
Bottom Line
This isn’t a single industry moving in one direction. It’s three very different paths:
TSMC is the structural winner with the clearest visibility
Samsung is the cyclical winner with structural upside
Intel is the turnaround with enormous optionality and real execution risk
The macro winds remain favorable, cloud spending is accelerating again, and the world is short advanced-node capacity for at least the next several years.
For long-term investors, the question isn’t which company will survive.
It’s which company will capture the lion’s share of the value created by AI.
And in that race, the differences between these three couldn’t be clearer.
This content is for educational purposes only and isn’t investment advice or a recommendation to buy or sell any security.